I have been spending some of my free time on a project that sits somewhere between a digital edition, a map experiment and a data-cleaning exercise: a viewer for the 1926 Groningen address book. The source is ordinary in the best possible way. It is not a famous manuscript or a spectacular map. It is a municipal address book: names, occupations, streets, house numbers, institutions, advertisements, and all the small administrative traces that make a city legible.
That ordinariness is exactly why I like it. Address books are dense historical sources. They show where people lived, what work they did, which institutions existed, how streets were named, and how a city described itself at a particular moment. But they are also awkward sources to use. A scanned address book is browsable, but not really searchable. A transcription is searchable, but it often loses the page as visual evidence. A spreadsheet can be analysed, but it rarely gives you the feeling of moving through a city.
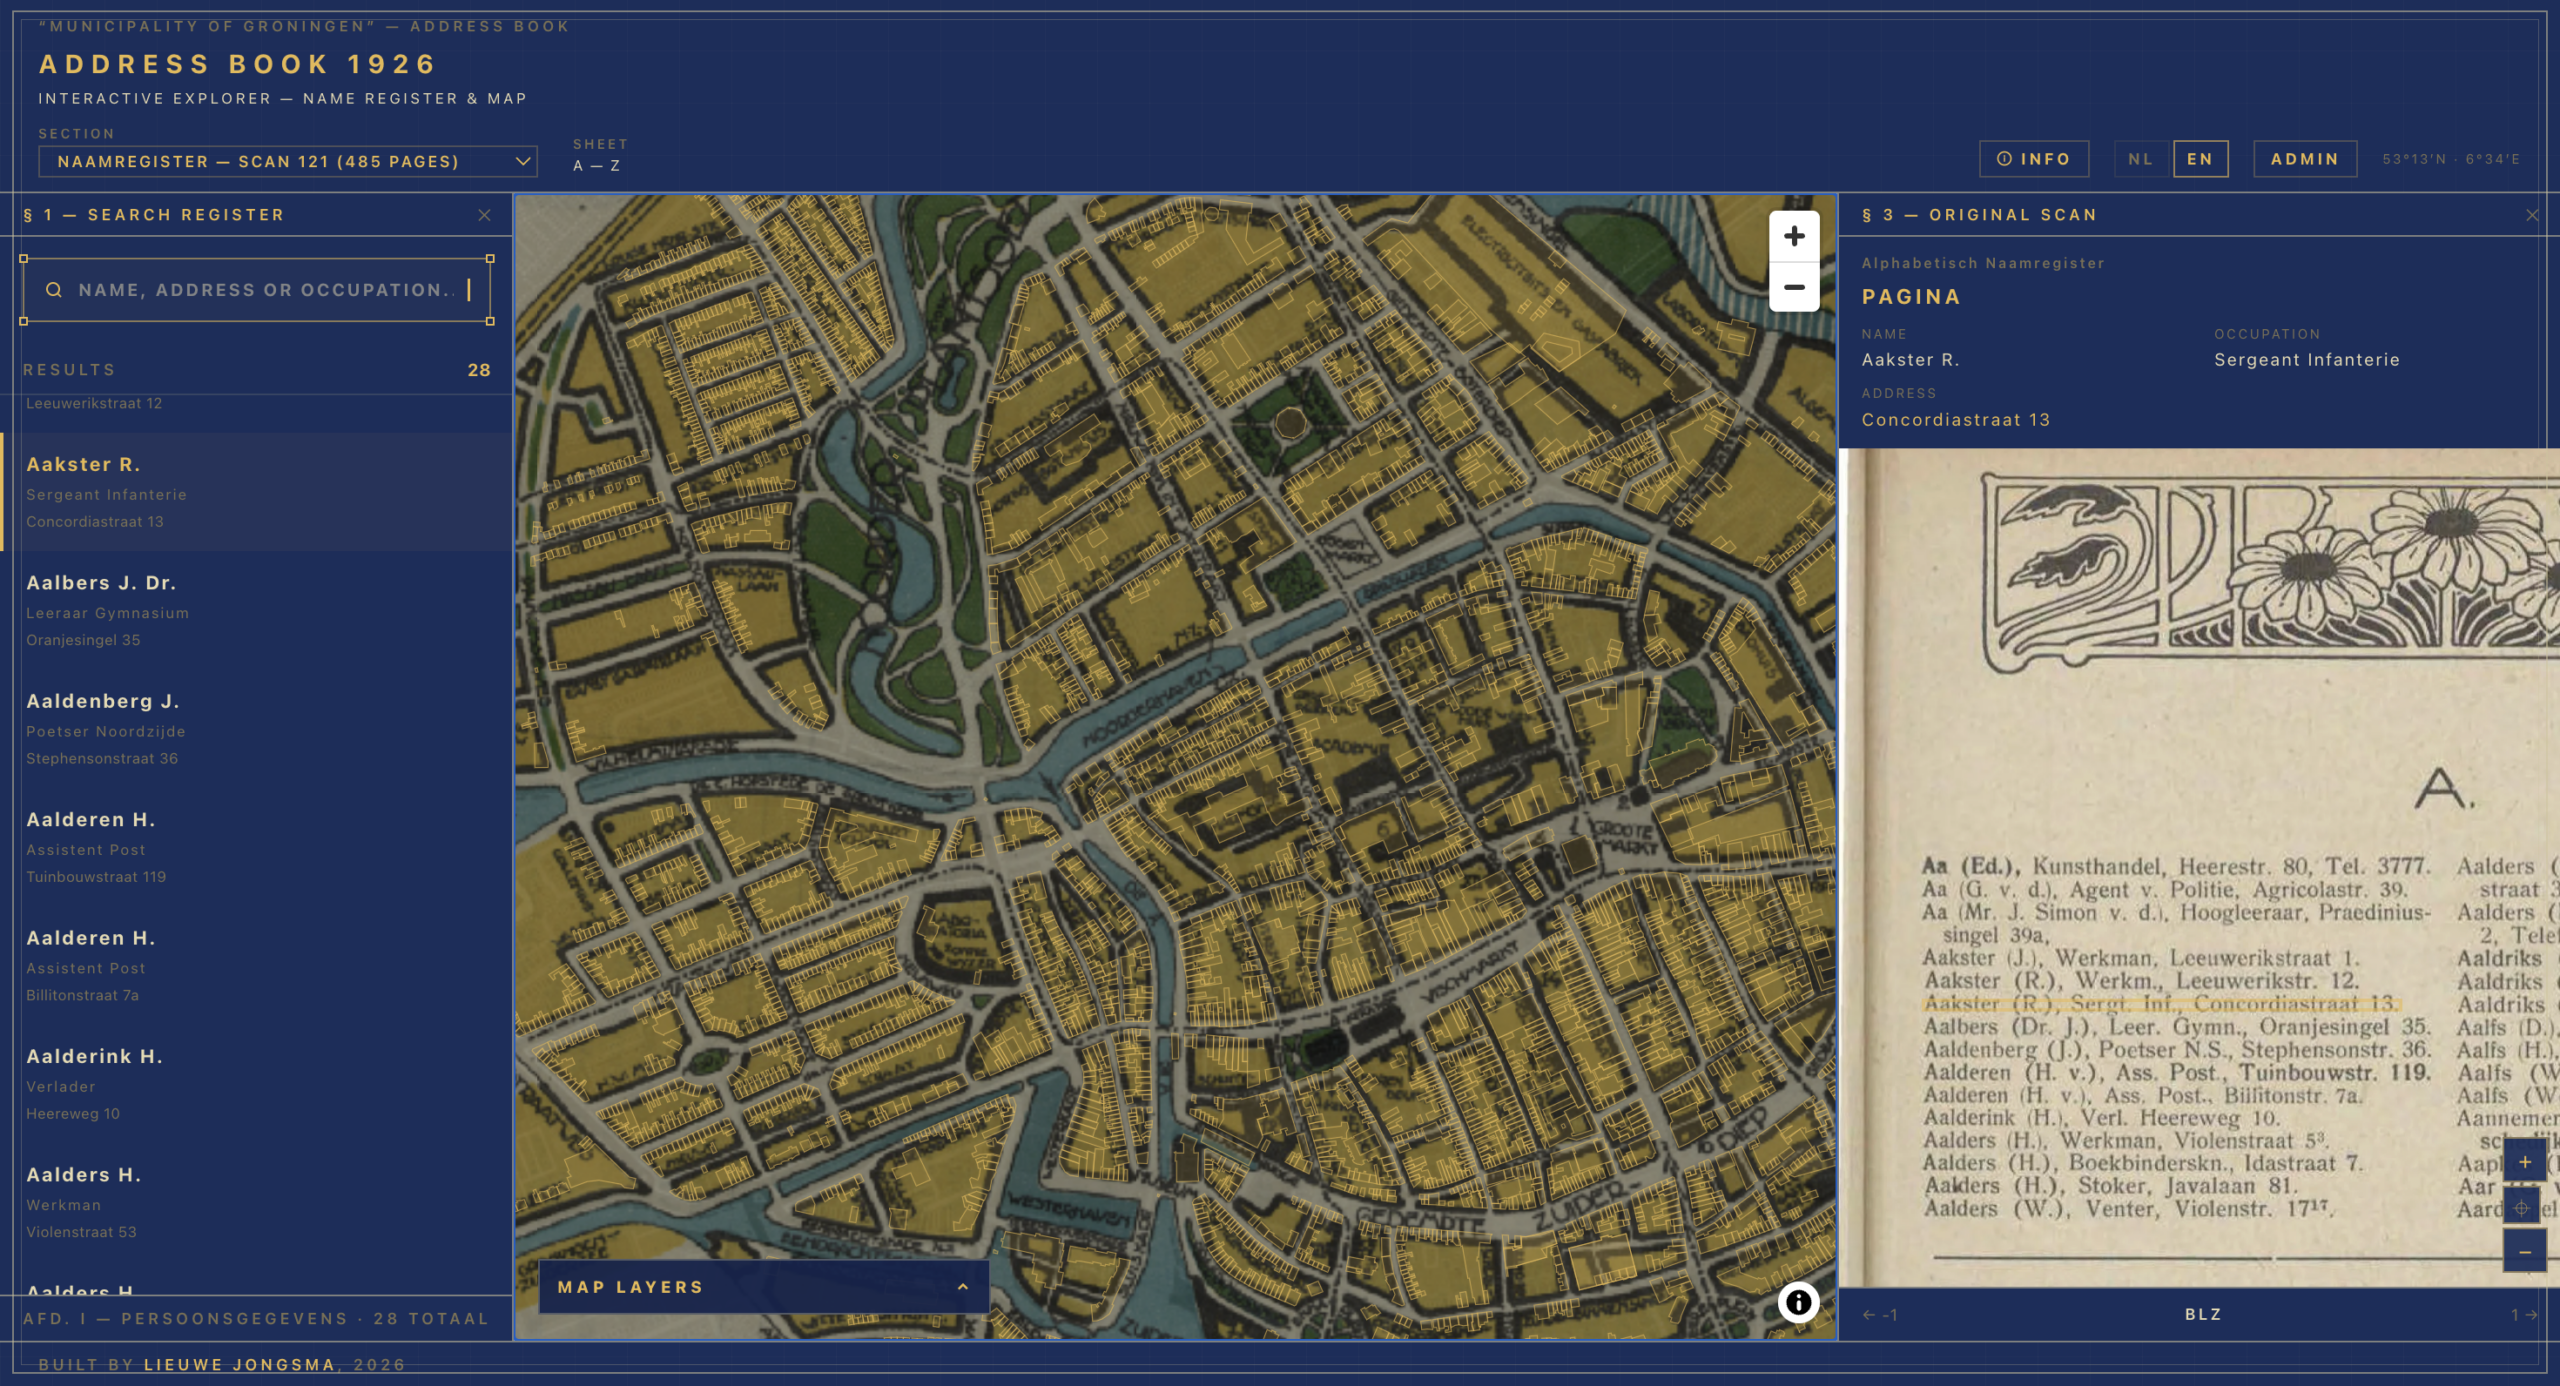
The experiment is to keep those things together: search, map, source image and structured data. You should be able to look up a person, see the original line in the book, and then jump to the corresponding place in Groningen. You should also be able to move the other way: start from a building on the map and ask who was listed there in 1926.
I am deliberately calling it an experiment. The viewer works, but the project is still very much in progress. I am still fixing bugs, normalising data, improving address matching and testing better approaches for the transcription pipeline. This post is therefore not a triumphant launch note. It is a field report: what I built, what worked, what remains difficult, and what I think might be reusable for colleagues in archives, museums and historical research who want to do something similar.
Where the idea came from
The immediate inspiration came from my experiences contributing to the exhibition Who Writes History? at the Groninger Museum. For that project we worked with Tapart on a map viewer. That experience stayed with me. A map interface can do something that a search box alone cannot: it lets people browse historically. It makes patterns visible, invites detours, and gives non-specialists a way into a large body of material without first needing to know the exact name or term to search for.
The transcription side also has a clear lineage. My colleague Cain Weideman laid important groundwork as a student in the RUG minor Data Wise. The Groningen Archives collaborate with that minor every year, and Cain’s group worked on methods for extracting data from address books in the context of the same exhibition. He did a great job and thought of some novel methods to not only transcribe the sources but also structure the data in a way that it could be used for applications such as this viewer. I built on his work to create a more robust and flexible pipeline. There was a problem here that we run into more often in our field: how do we turn somewhat structured historical sources into operational data without manually transcribing tens of thousands of lines?
Cain did that work so well that we later hired him. That is a nice institutional outcome, but it is also a reminder thatthese projects rarely come from one tool or one person. They grow through exhibitions, student projects, prototypes, conversations, and the stubborn realisation that the same problem keeps coming back in slightly different forms.
The source: a city in 60,783 entries
The current viewer is built around the 1926 address book for the municipality of Groningen. In the present data snapshot, the pipeline has processed 838 scanned page images and produced 60,783 entries. Those entries are not all the same kind of thing. The book contains an alphabetical name register, a street register, institutional listings, an occupation register, and a small number of advertisements and miscellaneous pages.
That variety matters technically. A name-register page behaves differently from a street-register page. In the name register, the main unit is a person or household-like listing: name, initials, sometimes a title or prefix, an occupation and an address. In the street register, the street and house number are the organising structure, with people listed under addresses. Institutional pages have another rhythm again. A robust pipeline cannot simply say: split each line into four columns and hope for the best.
It also matters historically. An address book is not a neutral census. It reflects editorial choices, commercial conventions, abbreviations, social categories and the practical limits of publication. Some occupations are abbreviated. Some addresses refer to older or variant street names. Some entries are cross-references. Some people appear in multiple sections. Some businesses and institutions appear in ways that do not map neatly onto the idea of one person at one home address.
That is why I have tried to keep the viewer close to the source image. The structured data is useful, but the scan remains the evidence. If a transcription looks odd, you should be able to inspect the line that produced it.
The transcription pipeline
The extraction pipeline is now its own reusable project: tables-ocr-pipeline (working title). The goal is not merely to OCR a page into plain text, but to produce structured, page-anchored data from historical registers. In other words: not just “what text is on this page?”, but “which records are on this page, which fields do they contain, and where on the image did they come from?”
The current pipeline combines several stages.
First, OCR and layout analysis detect words, lines and bounding boxes on the scanned page. For the Groningen address book I used Surya, which performs reasonably well on printed material and gives word-level coordinates. Those coordinates are essential. Without them the viewer could search the book, but it could not reliably highlight a specific entry on the original scan.
Second, the page is classified. A page from the name register should not be parsed with the same schema as a street-register page. The newer pipeline uses vision-based section discovery so that page type can be detected more dynamically, instead of relying entirely on a hand-maintained page map.
Third, a vision-capable language model turns the page into structured records. In the pilot run I used Gemini 2.5 Flash Lite through OpenRouter, with prompts and schemas tailored to the address-book sections. The full Groningen run cost about $7.50 in LLM API calls. That number is not a universal benchmark, but it is useful because it puts the scale of these experiments into perspective. For printed, table-heavy sources, the cost of trying this approach is no longer automatically prohibitive.
The most useful trick is that the model does not only return fields such as name, occupation and address. It also returns references to the OCR word IDs. That means a structured entry remains connected to the word boxes on the page. The pipeline can then calculate an entry-level bounding box and export both machine-readable data and source-image coordinates.
The outputs include per-page JSON, combined indexes, ALTO XML, PageXML support in the newer pipeline, and a SQLite database for the web viewer. The current viewer database contains 35,850 distinct normalised address strings. Of the 60,783 entries, 49,453 currently have geocoded coordinates, and 27,837 are linked to BAG building footprints. These numbers will change as I keep correcting and reprocessing data, but they give a sense of the present state.

The viewer architecture
The map viewer lives in a separate repo: groningen-adresboek-1926. It is built with Next.js, TypeScript, SQLite, MapLibre GL JS and OpenSeadragon.
SQLite with FTS5 handles search. That is deliberately boring technology, and I mean that as praise. For a dataset of roughly sixty thousand records, a local SQLite database is fast, portable and easy to rebuild from pipeline outputs. It avoids the operational overhead of running a separate search service while still giving good full-text search across names, occupations, addresses and expanded abbreviations.
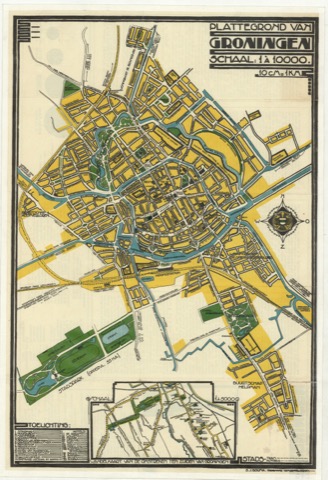
MapLibre renders the map. The modern geography comes from current map tiles and BAG building footprints. The historical layer consists of georeferenced map files from roughly the 1915-1935 period, served as Cloud Optimized GeoTIFFs. This makes it possible to place 1926 address data over both present-day geography and contemporary historical maps.
OpenSeadragon handles the scan viewer. The original page images are converted into Deep Zoom Image tiles using libvips, so the browser can zoom smoothly into a high-resolution page without loading the entire image at full size. When an entry is selected, the viewer can open the relevant scan, zoom toward the entry’s bounding box and show the line in context.
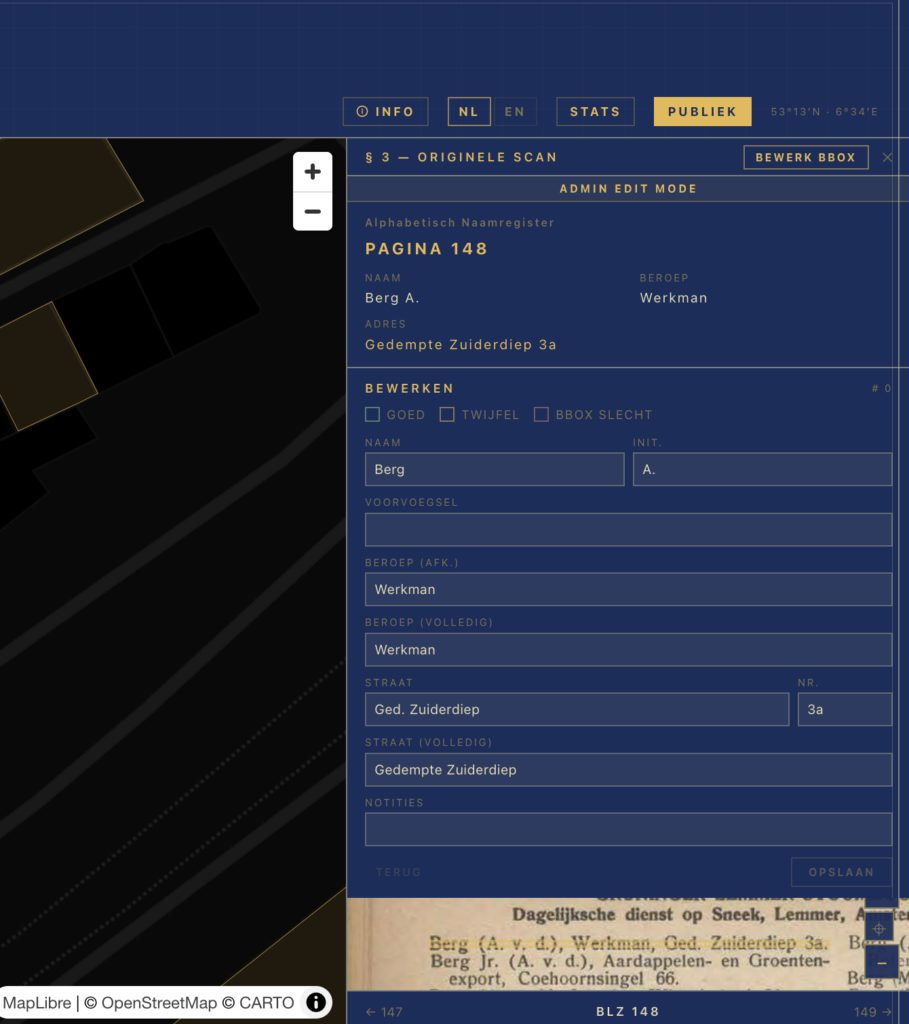
There is also an admin correction interface. That part is less glamorous, but it is essential. A public viewer quickly exposes data problems: wrong house numbers, old street names that do not match modern geocoding, bounding boxes that are slightly off, duplicate people, or entries linked to the wrong building. Corrections are stored as overrides and can be folded back into the data build. Recently I have been working on address normalisation, automatic PDOK re-geocoding after edits, person clustering, and clearer error reporting when corrections fail to save.
That correction loop is part of the architecture, not an afterthought. Historical data projects need a place for uncertainty and repair.
The journey of one record
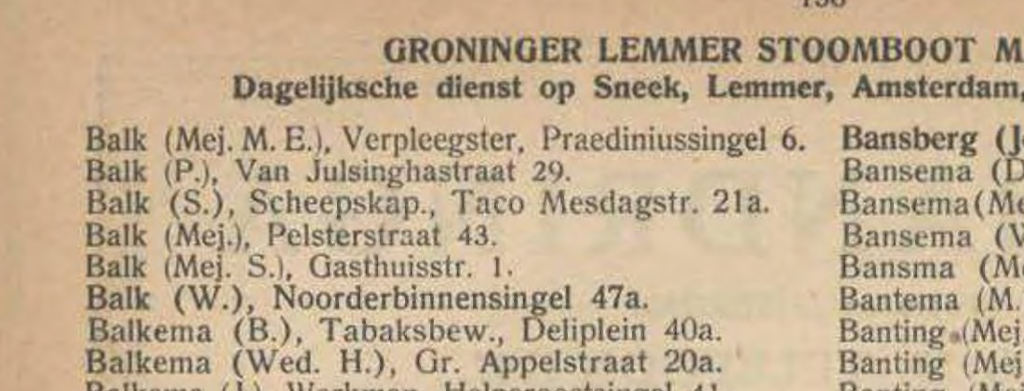
To make the architecture less abstract, take one record from page 136: M. E. Balk, listed as “Mej.”, occupation “Verpleegster”, at Praediniussingel 6.
The journey starts with a scan. On the page image, the entry is one line among many. The OCR stage identifies the words and gives each word an ID and bounding box. For this entry, the relevant word IDs connect the name, title, occupation and address to a narrow rectangle on the page.
The language-model stage then turns that line into structured data. It recognises “Balk” as the name, “M. E.” as initials, “Mej.” as a prefix, “Verpleegster” as the occupation and “Praediniussingel 6” as the address. The pipeline also keeps the original abbreviated or historical forms where useful, while adding expanded or normalised values for search and matching.
Next comes address normalisation. A human reader can usually understand historical abbreviations, old spellings and punctuation. A geocoder is less forgiving. The system therefore tries to turn the address into a form that PDOK can understand. In this case the normalised address remains simple: “praediniussingel 6”.
PDOK returns a match: Praediniussingel 6 in Groningen, with coordinates. The system then links that point to a BAG building footprint. In the current database this record is connected to a specific building ID, so the map does not merely show a loose pin; it can highlight a building polygon. In some cases this will actually be the same building as in 1926, but often the building may have been demolished or replaced since then. The map layer from the period 1915-1935 is essential for making sense of these mismatches.
Finally, the web viewer brings the pieces back together. A search for “Balk” can find the record. Clicking it opens page 136, highlights the line on the original scan, focuses the associated building on the map, and lets the user move between the record, the page and the place.
That is the small conceptual leap I find most interesting. The record is not just extracted from the book. It remains attached to the book, while also becoming part of a spatial interface.
What proved difficult
The hardest parts are not always the most flashy ones. Getting a vision model to return plausible structured data is only one part of the work. Much of the real difficulty sits in the unglamorous middle: alignment, normalisation, linking and correction.
Historical address notation is a good example. The address book contains abbreviations, older spellings, parenthetical suffixes and street-name variants. Some forms map cleanly to modern PDOK queries. Others need explicit rules. In the current codebase I have rules for cases such as Heereweg becoming Hereweg, Visscherstraat becoming Visserstraat, A-Kerkhof becoming Akerkhof, and parenthetical forms such as “Heereweg (verlengde)”. These are small rules, but each one can move many records from “unmatched” to “usable”. I considered using a more automated “fuzzy matching” approach, but since there are many street names that are very similar but still distinct, that approach would be too error-prone.
Geocoding is another source of false confidence. A returned coordinate is not automatically a good coordinate. PDOK can return street-level matches, municipal matches, or approximate results when a house number cannot be found. In the present dataset, many geocoded entries carry uncertainty flags. Those flags matter. It would be easy to draw every result as if it were equally precise, but that would mislead users.
Bounding boxes also need attention. OCR engines are not perfect, and one early issue involved word boxes collapsing into clusters, which caused highlights to miss part of the line. The fix was not a prompt tweak but a geometry repair: compare word boxes to the line box and redistribute them when they clearly fail. This is typical of the project. Some problems look like AI problems from a distance, but the fix is often ordinary data engineering.
The map adds its own challenges. Modern BAG buildings do not perfectly represent the built environment of 1926. Streets have changed. Buildings have disappeared, merged or been renumbered. A historical map overlay helps users interpret the results, but it does not magically solve historical geography. The viewer therefore has to be honest about uncertainty and allow manual correction.
Performance and usability also matter. The scan images are large, so they need tiling. The map can contain thousands of clickable building footprints, so it needs careful rendering. Search should feel immediate. The interface should make the source visible without forcing users to understand the pipeline behind it.
What might be reusable
For colleagues in the archival and heritage field, I think the reusable part is not the exact Groningen configuration. It is the pattern.
Start with a source that has a somewhat regular structure: address books, registers, census-like lists, membership rolls, tax ledgers, school registers, patient lists, institutional directories. Use OCR or HTR (or a combination of both) to get text and coordinates. Use a structured extraction layer to turn page text into records. Preserve word or line references so every record can point back to the scan. Export to formats that are useful beyond the web app, such as JSON, ALTO or PageXML. Build a lightweight database for search. Add geocoding or entity linking only where it genuinely serves the source. Then build a viewer that keeps source, data and interpretation connected.
This is not a magic pipeline. Each source still needs decisions. What is a record? Which fields matter? How should abbreviations be expanded? Which errors are acceptable? Which uncertainty should be visible to users? When does automated matching become misleading? Those questions are archival and historical questions as much as technical ones.
The encouraging part is that the technical scaffolding is becoming more reusable. The separate OCR pipeline is now moving toward a more engine-agnostic design. Surya works well for clean printed material. Loghi may become useful for handwritten or mixed sources. PageXML support makes the outputs more compatible with existing heritage tooling. Local vision models through vLLM may reduce dependency on commercial APIs for larger runs. I am not there yet, but the direction is clear: less one-off scripting, more reusable extraction machinery.
If there is interest, I could imagine writing a more practical follow-up: how to adapt this approach for another collection, what minimum ingredients are needed, and where I would be cautious. For now, I hope this post gives enough detail to make the method legible without pretending it is a finished manual.
Still in progress
The viewer is live, but I would not describe the dataset as finished. I am still stomping out bugs, refining the data and improving the correction tools. Some records are wrongly matched. Some are not matched at all. Some people are clustered imperfectly. Some historical addresses need better normalisation. Some pipeline outputs should be regenerated as the OCR and alignment code improves.
As for the pipeline, as I briefly mentioned above, I’m also working on a version of the pipeline that uses Loghi for transcriptions. Surya would still do the layout analysis, but a lightweight vision model would judge each page on whether it was handwritten or printed (or a combination thereof), and then trigger an appropriate transcription engine. Loghi performs really well on printed material, but it is also capable of transcribing handwritten documents. That versatility opens up a lot of possibilities. I haven’t yet had the chance to properly test this, but you’ll read more about it here in the near future.
That is part of the point. Digital heritage projects often look cleaner from the outside than they feel from the inside. The public interface can be polished while the data underneath remains a living object. I would rather be explicit about that than present a static result that hides the work still needed.
The project also keeps opening new doors. Every time I fix one problem, I find another tool or method that could improve the pipeline: better page classification, more robust schemas, PageXML workflows, Loghi for handwritten material, local models on stronger hardware, richer correction exports, better feedback loops between viewer and data build. I expect to write updates as those experiments mature.
For now, I am happy with the basic proof of concept: a printed address book can become a searchable, spatial, source-linked interface without severing the data from the archival object. That feels like a useful direction for many heritage collections. Not because every source needs a map, but because many sources deserve interfaces that let users move between record, page, place and context.