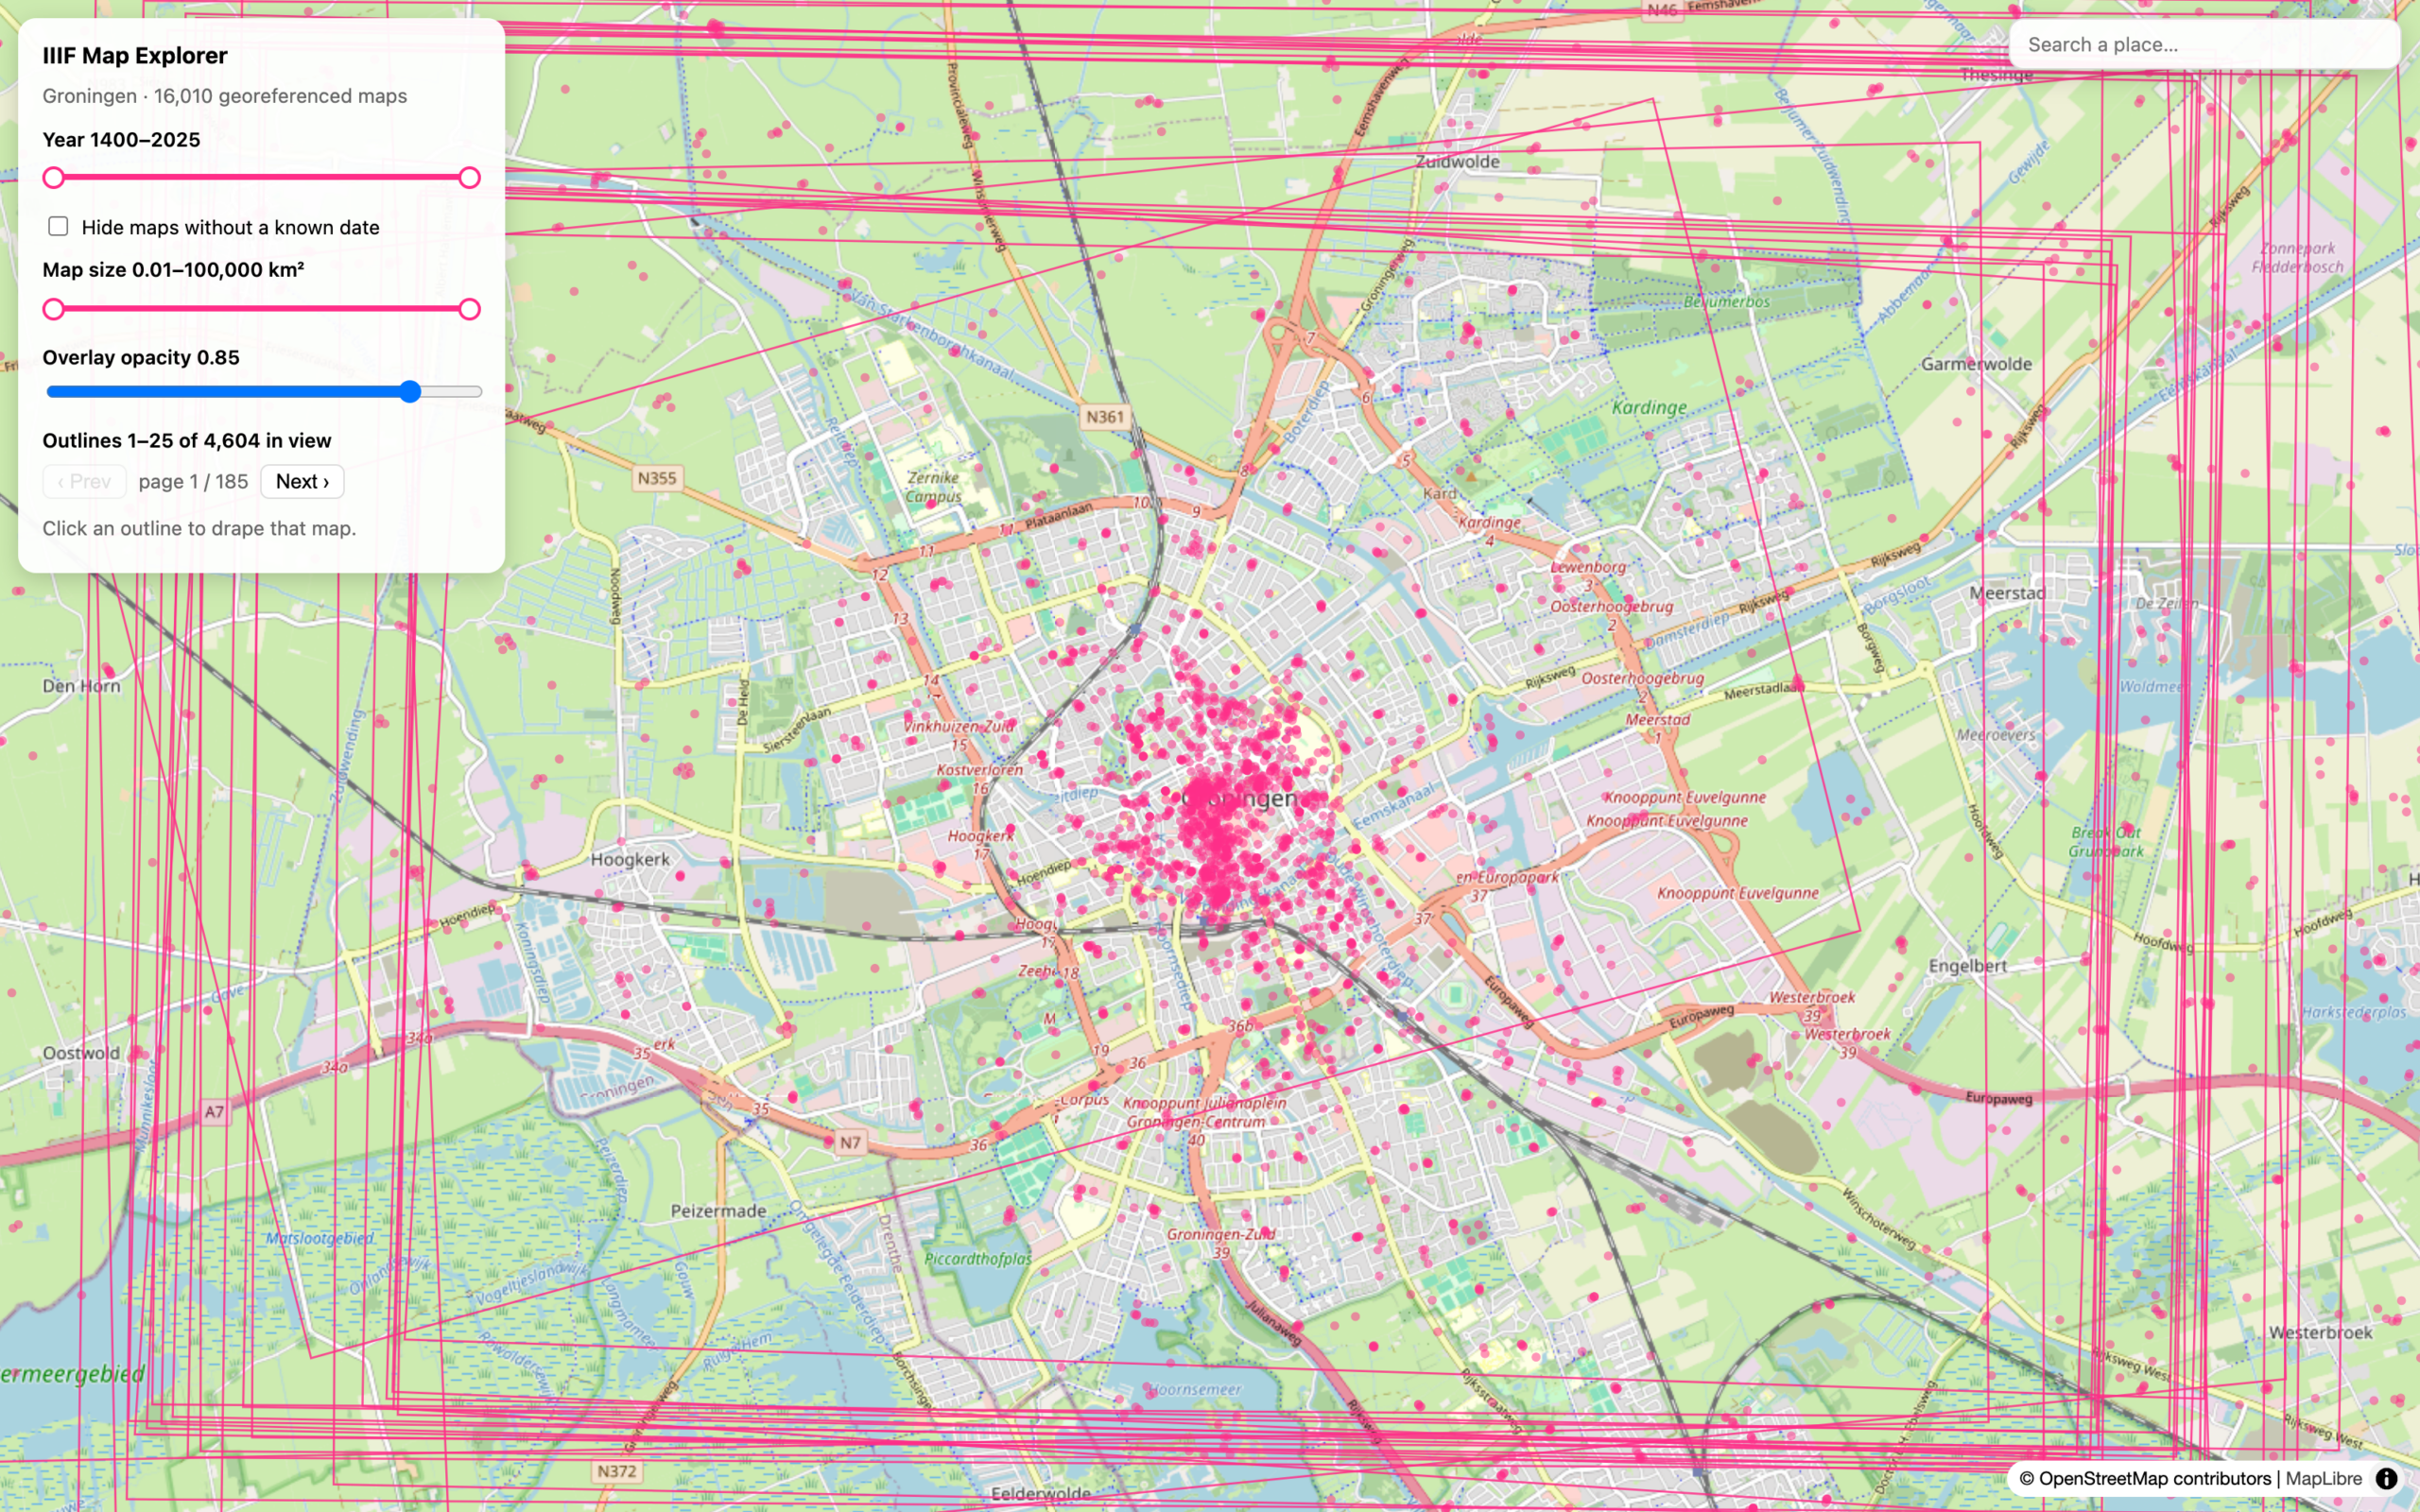
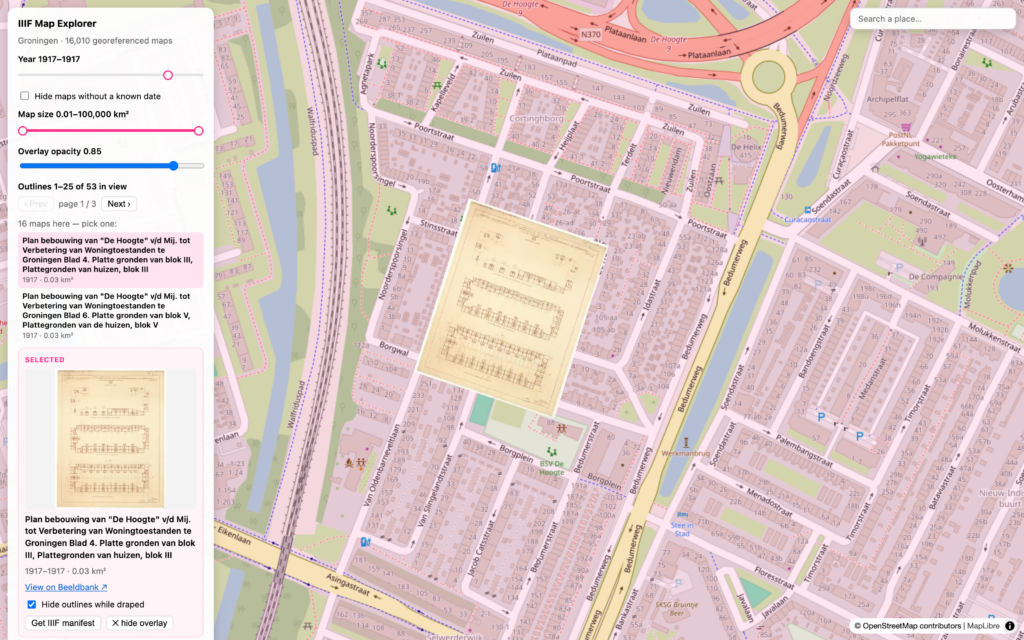
Not every map everywhere, admittedly. But every map the Groninger Archieven has scanned and georeferenced, sixteen thousand-odd of them. I built a map explorer that lets you roam the whole collection at once. You can see which maps cover any spot you point at, from several centuries and at every scale, then drape any of them over today’s map in your browser. Zoom in on the city and pick the 1918 design for the workers’ houses of De Hoogte, drawn by the architect A.Th. van Elmpt for a housing association set up to clear the city’s slums, and it lines up on the blocks that were built from it, at the right angle, with an opacity slider to compare the plan against the present.
The explorer is built on IIIF, the International Image Interoperability Framework, which more and more digitised-image work at archives and libraries now runs on. Its core is the Image API. Instead of downloading a whole image, a viewer asks the source institution’s server for exactly the part it wants, by region, size, and rotation, in a structured URL. There is one authoritative copy, held at the source, and any compliant viewer anywhere can pull from it. So a scan from Groningen and one from the British Library behave the same in any viewer.
The code for rendering the geography comes from Allmaps (an open-source project out of TU Delft, built in collaboration with cartographer Bert Spaan), which lets you drape a historical map over the modern world and pin it to real coordinates. Warping the data instead of the map, as they put it: you don’t redraw the old map to fit today’s coordinates; you leave the scan untouched and warp it, live in the browser, onto the modern web map underneath. The coordinates live in a separate file: a Georeference Annotation, its own small standard (a W3C Web Annotation, in the schema Allmaps uses) that points at a IIIF image and records which pixels sit at which points on the globe. The image never moves from the archive’s server; only the thin layer of geography is new.
Allmaps reads the annotation, pulls the Image API tiles for whatever’s on screen, and warps them onto the modern map in the browser. Any map, from any institution, lined up on the real world in a browser tab, no GIS server required. One map at a time is a solved problem, which got me thinking about scale. What would it take to move through a whole collection of sixteen thousand at once?
From one map to the whole collection
An archive the size of the Groninger Archieven doesn’t really keep developers on staff. It publishes its material, and a lot of the interesting things done with it happen elsewhere, built by whoever picks it up, which used to mean a university or a vendor.
The Groninger Archieven’s Beeldbank holds roughly sixteen thousand georeferenced maps, and it already has pretty decent functionality to show individual georeferenced maps: open any scan and it sits on a modern map, with a transparency slider of its own. What it isn’t built to do is show the collection as a whole. You can study a map once you’ve found it, but you can’t easily ask which maps cover the street you grew up on, or stack three eras of the same area.
To do that, I needed every map’s footprint in one place. Each georeferenced scan carries its geographic bounds near the very front of the file, around byte 145, so I could read just the first sixteen kilobytes of each instead of pulling the whole ten-megabyte image from the Beeldbank server. Across sixteen thousand maps that is roughly a six-hundred-fold saving in bandwidth, which made harvesting the data I needed nice and snappy. From those bounds I built a standard Allmaps Georeference Annotation for each map, the format the explorer needs to warp them on demand.
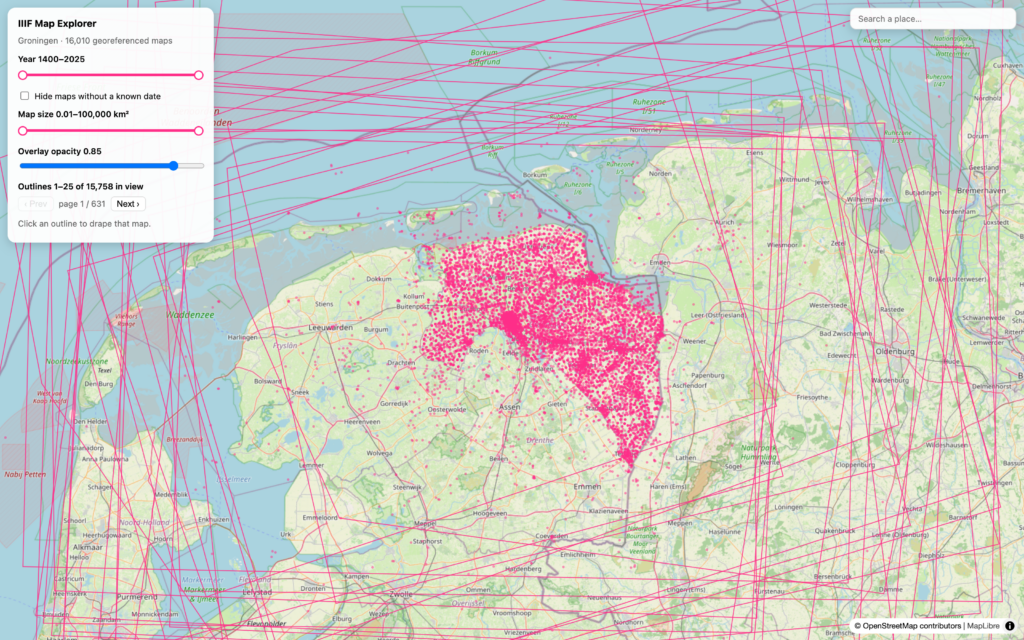
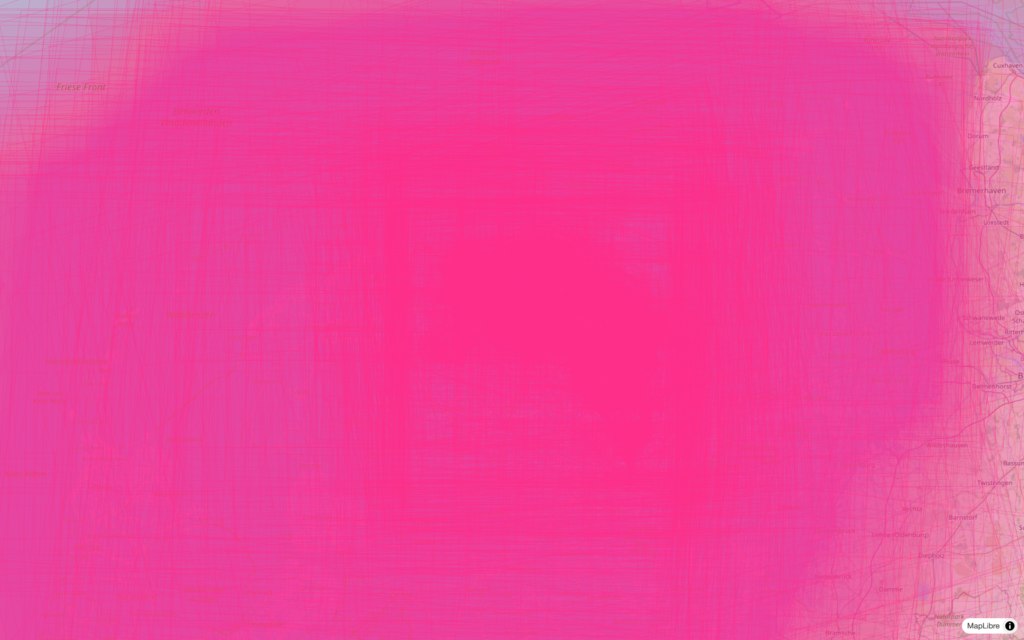
Now you have sixteen thousand outlines and a little problem. Draw them all at once and, at province zoom, the translucent rectangles pile into a single opaque pink soup. Technically every map is there; in practice you can’t see or pick any one of them. The fix: rank the outlines by how well each fits the current view, draw the best couple of dozen, page through the rest, and drop a locator dot for every map so you can see where the dense areas are. Click one and that map warps into place over the modern city, with an opacity slider. Filter the set by date or by physical size, and sixteen thousand sheets narrow to the handful you actually want.
One cool thing about this viewer is that it finally gives me (the person responsible for this data at the Groninger Archieven) insight into some of the outliers. The data, once you actually read it, is messier than I knew. A handful of maps parsed to footprints larger than the planet, one of them about 2.3 billion square kilometres, because their georeferencing used a transform my parser couldn’t handle; left in, they broke the rendering for everything else. Ninety-odd of these had to be rejected outright, which leaves the 16,010 maps that made it into the map explorer. Others were fine but stored tilted inside a transparent canvas, so their true rotated outline had to be recovered by reading the scan’s transparent border and tracing the edge of the actual image.
What one person can build now
The familiar assumption is that something like this takes an institution: a team, a substantial budget, a beast of a server. It was actually a pretty straightforward build that took me a few evenings, thanks to today’s open standards, open source solutions and (last but certainly not least) my coding agent.
The whole explorer is a tiny static site. There is no backend, just a set of static files, the outlines and the per-map annotations, served from a small VPS. The map imagery itself never passes through my server: it streams straight from the archive’s IIIF server into the visitor’s browser, which warps it onto the basemap. Much of the code was written with an AI coding assistant, which is part of why “a few evenings” was possible at all, and something I’ve written about elsewhere.
I could move quickly for another reason, too: the hard part was already done, and openly accessible. IIIF is an open standard; Allmaps is open source. So rather than write the warping, tiling and annotation-parsing myself, I leaned on Allmaps’ libraries and adapted them to what I needed. The map shell itself I mostly had already, from mapping Groningen’s 1926 address book. Open standards plus open code is why this was fast. So it’s open source in turn, for whoever wants to build on it next.